| About_Us | Sponsors | Staff | Links | Site Map | Login |
| Issues | |||||
|
|
|||||||||||
| Issue | Summary | Positions | Facts | Polls | Discussion | Also_See |
|---|
WeMatter.com > Federal Budget >Facts
Topic: What are the raw numbers that are appropriate to this issue.
In 2002 the GNP, is {all figures in billions of dollars}:
$10,846
Federal government is planning to collect about:
$2,135, {21% of GDP, The states spend an additional 9%, see: as of 2000 page 295/308} of which,
$1,024.2 {47%} is from Income taxes,
$721.9 {33%} is Social Security, and
$229.1 {10%} is from Corporate taxes.
This money was planned to be spent, as follows:
$429.9 Social Security
$374.4 Non-Defense {Discressionary}
$304.0 Defense
$224.9 Other {Non-Discressionary}?
$214.2 Medicare
$130.3 Medicaid$171.2 Surplus {Social Security}
Note: The Citizens Against Government Waste estimates that: . "If Congress truly wants to preserve surpluses for this year and many years to come, they should begin by eliminating all pork projects from the federal budget – $18.5 billion last year alone." {Though of course one person's pork is an others bacon}
The $5,753 end of 2002 Debt is planned to be, as follows:
$2,453 Owned by the US Government {Social Security lock box} {at 6% interest, this is saving the tax payer $147 B/year}
$3,300 Owned by citizens and others.
The "Adjustment" to the previous budgets, to make the surplus, excluding Social Security, 0 in 2001, and 2002 was:
2001 2002 -$46 -$44 Economic adjustments -$40 -$40 Tax rebates and other enacted tax change -$28 $28 Corporate tax timing shift -$5 -$1 Farm Assistance -$4 -$11 Defense requirements -1 -6 Related debt service 0 $3 Tax Proposals $3 $11 Medicare reform (cuts) -123 -59 Total change in surplus (- = Reduction)
Tax cuts in 2011, due to different parts. (as originally proposed?)
100% -- 231.7 B$ ---- Total tax cut {that year} 7% of 3,223 ( Receipts)
See: Table S-9. Effect of Proposals on Receipts,
As a way of "thinking" about the budget, I have developed an analogy, I hope that it is useful and not biased, It thinks about the Government as a family who is the major stockholder in a widget company: For more detail See Analogy
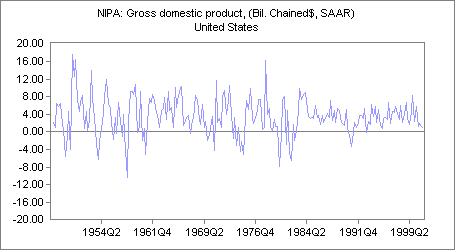
The following is that GDP growth over the last 50 years. It looks to me as though there has roughly been a 8% growth except for a larger growth in the '65 to '85 period, and a slower growth recently.
- 1969 Nixon
- 1974 Ford
- 1981 Carter
- 1985 Reagan
- 1989 Bush
- 1993 Carter
- 2001 Bush
| New Rate (Old) |
Single income
|
Married Income
|
|
| 10% |
$7,000
|
$14,000
|
|
| 15% |
$28.400
|
$58,600
|
|
| 25% (27%) |
$68,800
|
$114,650
|
|
| 28% (30%) |
$143,500
|
$174,700
|
|
| 33% (35%) |
$311,950
|
$311.950
|
|
| 35% (28.6%) |
Over $311,950
|
Over $311,950
|
Individual Income Tax Returns, Preliminary Data, 2001
| Gross Income |
< $15,000
|
15 - $30,000
|
30 - $50,000
|
50 - $100,000
|
100 - $200,000
|
> $200,000
|
| Num of Returns |
38.2 M
|
30.1 M
|
24.5 M
|
26.5 M
|
8.4 M
|
2.5 M
|
| Ave Income |
$5,612
|
$21,960
|
$39,087
|
$69,466
|
$131,630
|
$539,327
|
| Total Tax Liability |
$7,2 B
|
$38.6 B
|
$88.4 B
|
$223.6 B
|
$193.556
|
$376.7 B
|
| Ave Tax (Percent) |
$489 (8.9%)
|
$1.755 ($7.9%)
|
$3.774 (9.6%)
|
$8,471 (12%)
|
$22,833 (17%)
|
$146,537 (%27%)
|
Otherwise you may proceed to other issue related pages:
Summary Positions Facts Polls Discussion Also_See
Home About us Sponsors Links Staff Site_Map Contact Us
Note: As with all sites , this site is under construction. On the other hand at this time I consider it only a design site so that any links are missing, Graphics are missing etc. This is discussed in the TBD section